
Converting Number Columns into Categories/ranges
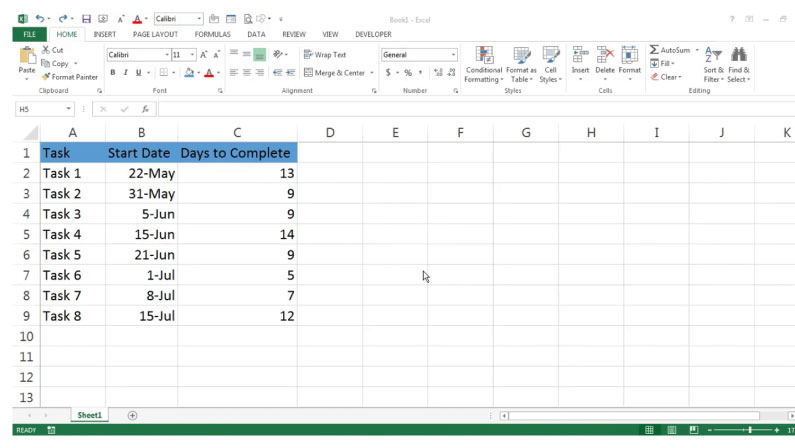
Have you ever found yourself in need of converting number columns into categories/ranges? Number columns are continuous in nature and may take more time to visualize as compared to when they are categorical. For instance, a column of ten data points would produce ten different bars in a bar chart. On the other hand, grouping this data into two groups would only require two bars in the bar chart. It is crystal clear that it would take a person more time in generalizing information about the ten-point as opposed to when the data is categorical. The reason behind this is the fact that discrete ranges accommodate more than one continuous numbers.
Case Considered
A case on point is when you want to plot a chart of the age of people. With the help of continuous data, a line graph can help your know the distribution of ages among the people. However, if you want to know which age group has the highest frequency you need to classify the ages into age groups probably young, middle age and old age. Categorizing data such as age helps one to quickly associate a person to a particular age group.
MS Excel VLOOKUP function can save you time in classifying number columns into categories. The formula is given by =VLOOKUP(lookup_value, table_array, col_index_num, TRUE). The look-up value is the specific number to classify into age, table-array is the data containing the categorization rule, col_index_num will give the specific column number to return the category and TRUE implies the exact match of the lookup value.
VLOOKUP Procedure in Classifying Number Columns
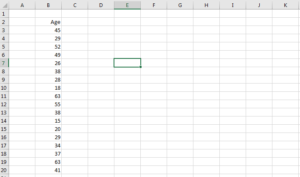
Assume you have an age column in MS Excel and you want to group the age into five classifications. The data look as follows;
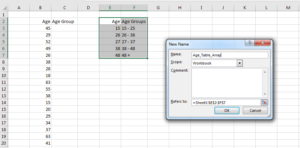
The aim is to classify those ages into five groups as below
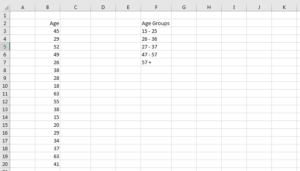
2. Starting from cell E3 up to E26 insert the lower bound of the age group then name cell C2 as Age Group and cell E2 as Age.
2. Using formula tab, name the range of cells E2 to F7 as Age_Table_Array.
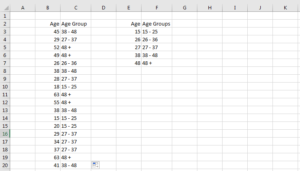
3. Go to cell C3 and enter the following formula =VLOOKUP(B3,Age_Table_Array,2,TRUE).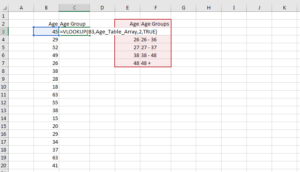
4. Hit Enter key on your keyboard and fill age group using the fill handle. You should get same result as below.
It’s clear from the above excel procedure, that you can easily classify number columns into different categories. This is not only limited to few data points but to millions of data records. It would save you a lot of time when analyzing large amount of data thus increasing your workplace productivity. Other lookup techniques include vlookup function with choose method and index-match methods.
To fully equip your hands on skills in number crunching techniques, please attend our upcoming Advanced Microsoft Excel training.